
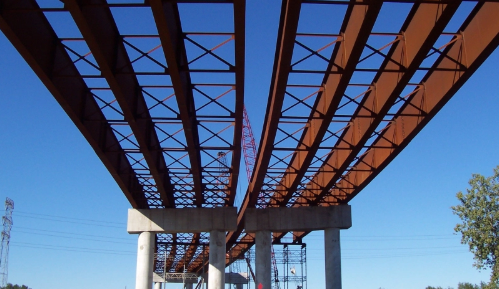
Designing for fatigue is very different than designing for static loads. One of the biggest challenges is being able to estimate the loads, timing of the loads and duration of the loads. If you look at a bridge you have to estimate the number of vehicles going on the bridge every day, the weight of these vehicles, and other forces and loads acting on the bridge such as its own weight (steel and concrete), wind loading, and pre-existing stresses such as those caused by welding.
Four of the main factors that will affect the fatigue life of a welded structure are:
- Loading rate
- Loading magnitudes (stress range)
- Temperature
- Quality of fabrication (workmanship)
Loading rate refers to how quickly the peak load is reached. Fast loading rates are measured in thousands of a second, whereas slow loading rates typically are those that can take several seconds to be reached. When materials are tested the loading rates are typically 0.001 seconds for fast (dynamic) loading and 100 seconds for slow loading. So what is the effect on fatigue life? The faster the loading rate, the shorter the fatigue life. Conversely, the slower the loading rate the longer the fatigue life.
Loading magnitudes are very important in estimating fatigue life. However, what is really important is the different between the stress at the peak (maximum stress) and the stress when the load is removed or reversed (minimum stress). For example, the applied load P (see sketch below) translates to 15,000 psi. This load can be a vehicle going over the bridge. When the load is removed (the vehicles is through the bridge) the applied stress is 0 psi (neglecting the weight of the girder, concrete and other static loads for the sake of this example).
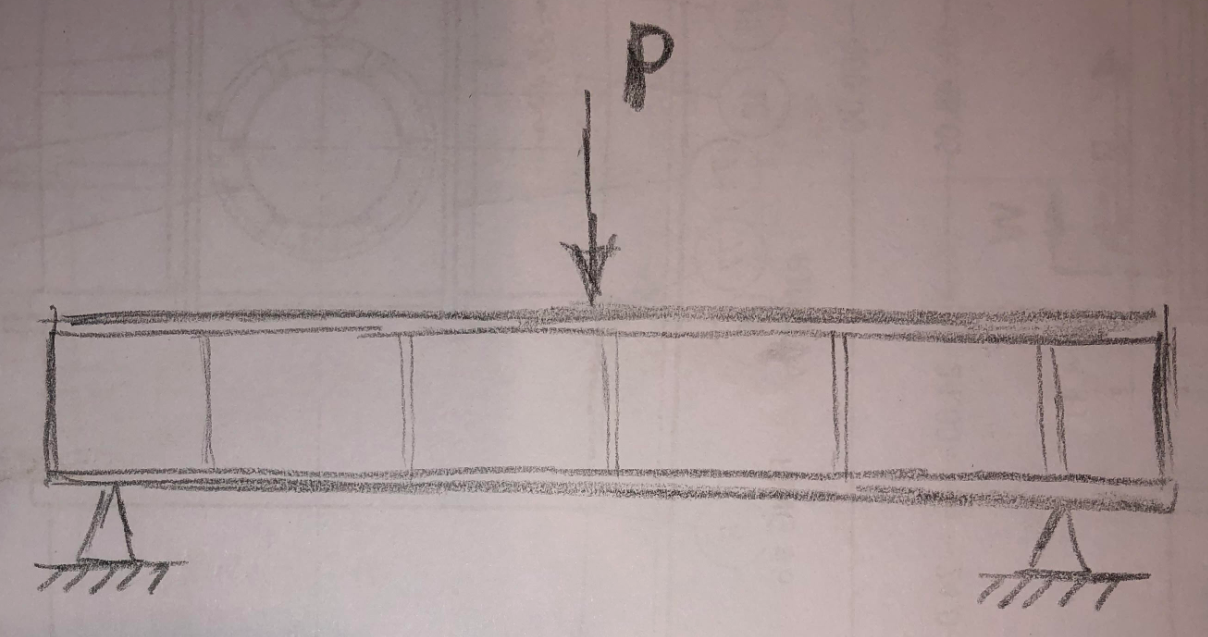
In this case the stress range is equal to the maximum stress minus the minimum stress…
Stress Range (1) = 15,000 lb/in² – 0 lb/in² = 15,000 lb/in²
If we have another situation in which the applied peak stress is higher, say 25,000 lb/in², but the minimum stress is 18,000 lb/in² (this may be due to the structure’s weight or design) the stress range would be
Stress Range (2) = 25,000 lb/in² – 18,000 lb/in² = 7,000 lb/in²
Although the peak stress is higher in the second scenario, the first scenario would have a shorter fatigue life due to the magnitude of the stress range. So, the larger the stress range the shorter the fatigue life and vice versa.
Temperature is very important for fatigue life. For structural steels, as temperature decreases so does its fracture toughness, or its ability to resist the propagation of a crack. Fracture toughness can be tested in a lab. You may have heard of the Charpy v-notch test. Typically these tests are done at temperature ranging from -80˚F to 0˚F. This is done because structural steels have sharp drop in fracture toughness once the temperature dips below freezing. This is especially important for bridges and other structures that are in service in colder regions.
Since fracture toughness decreases as temperature decreases, the lower the temperature the lower the fatigue life.
Quality of fabrication refers to the presence, or hopefully absence, of fabrication defects. When we weld we can have many different types of defects such as undercut, overlap, porosity, cracks, excessive convexity, etc. All these discontinuities will act as stress risers. This means that a given stress will be magnified to different degrees in the presence of these discontinuities.
This is why welding codes impose more stringent requirements (less allowances) for discontinuities in cyclically loaded members as compared to their statically loaded counterparts.
Conservative design will assume that there are pre-existing flaw, such as those mentioned above. This is a safety net for errors in fabrication and inspection.
You may be wondering why there was no discussion of the strength of the steel when considering fatigue life. This is because after welding, the fatigue life is dominated by the weld discontinuity. This discontinuity is not necessarily a flaw; it could simply be the change in geometry). For structural steels (yield strengths ranging from 36,000 lb/in² to 140,000 lb/in²) fatigue life improves with higher strength, but as mentioned above, as soon as we weld the fatigue life is governed by the quality and geometry of the weld.
If you look at AWS D1.1 you’ll find that the different stress categories (A, B, B’, C, D, E, E’ and F) are not dependent on the yield strength of the steel but strictly dependent on geometry and type of loading as can be seen below.
References: